Overview
The DataNova User Manual is your complete resource for understanding and utilizing all of DataNova’s powerful analytics capabilities. Whether you are a beginner exploring basic statistics or an expert leveraging machine learning models, this guide ensures you can extract meaningful insights from your data. With DataNova, you can seamlessly import, analyze, and visualize your data using an intuitive interface designed for efficiency and accuracy.
Core Concepts
Data Import & Preparation
DataNova allows you to import datasets from multiple sources, including Excel, Google Sheets, and OneDrive. Efficient data preparation is key to accurate analysis, and DataNova provides built-in tools to help you:
- Clean your data: Remove duplicates, handle missing values, and standardize formats.
- Transform columns: Apply normalization, encoding, and other transformations for better analysis.
- Merge datasets: Combine multiple data sources effortlessly for comprehensive insights.
Statistical & Machine Learning Models
DataNova offers a variety of pre-built statistical and machine learning models that can be applied in just a few clicks. Depending on the nature of your data, you can choose from:
- Regression Models: Identify relationships between variables and predict numerical outcomes.
- Classification & Clustering: Categorize your data into meaningful segments.
- Time-Series Analysis: Forecast trends based on historical patterns.
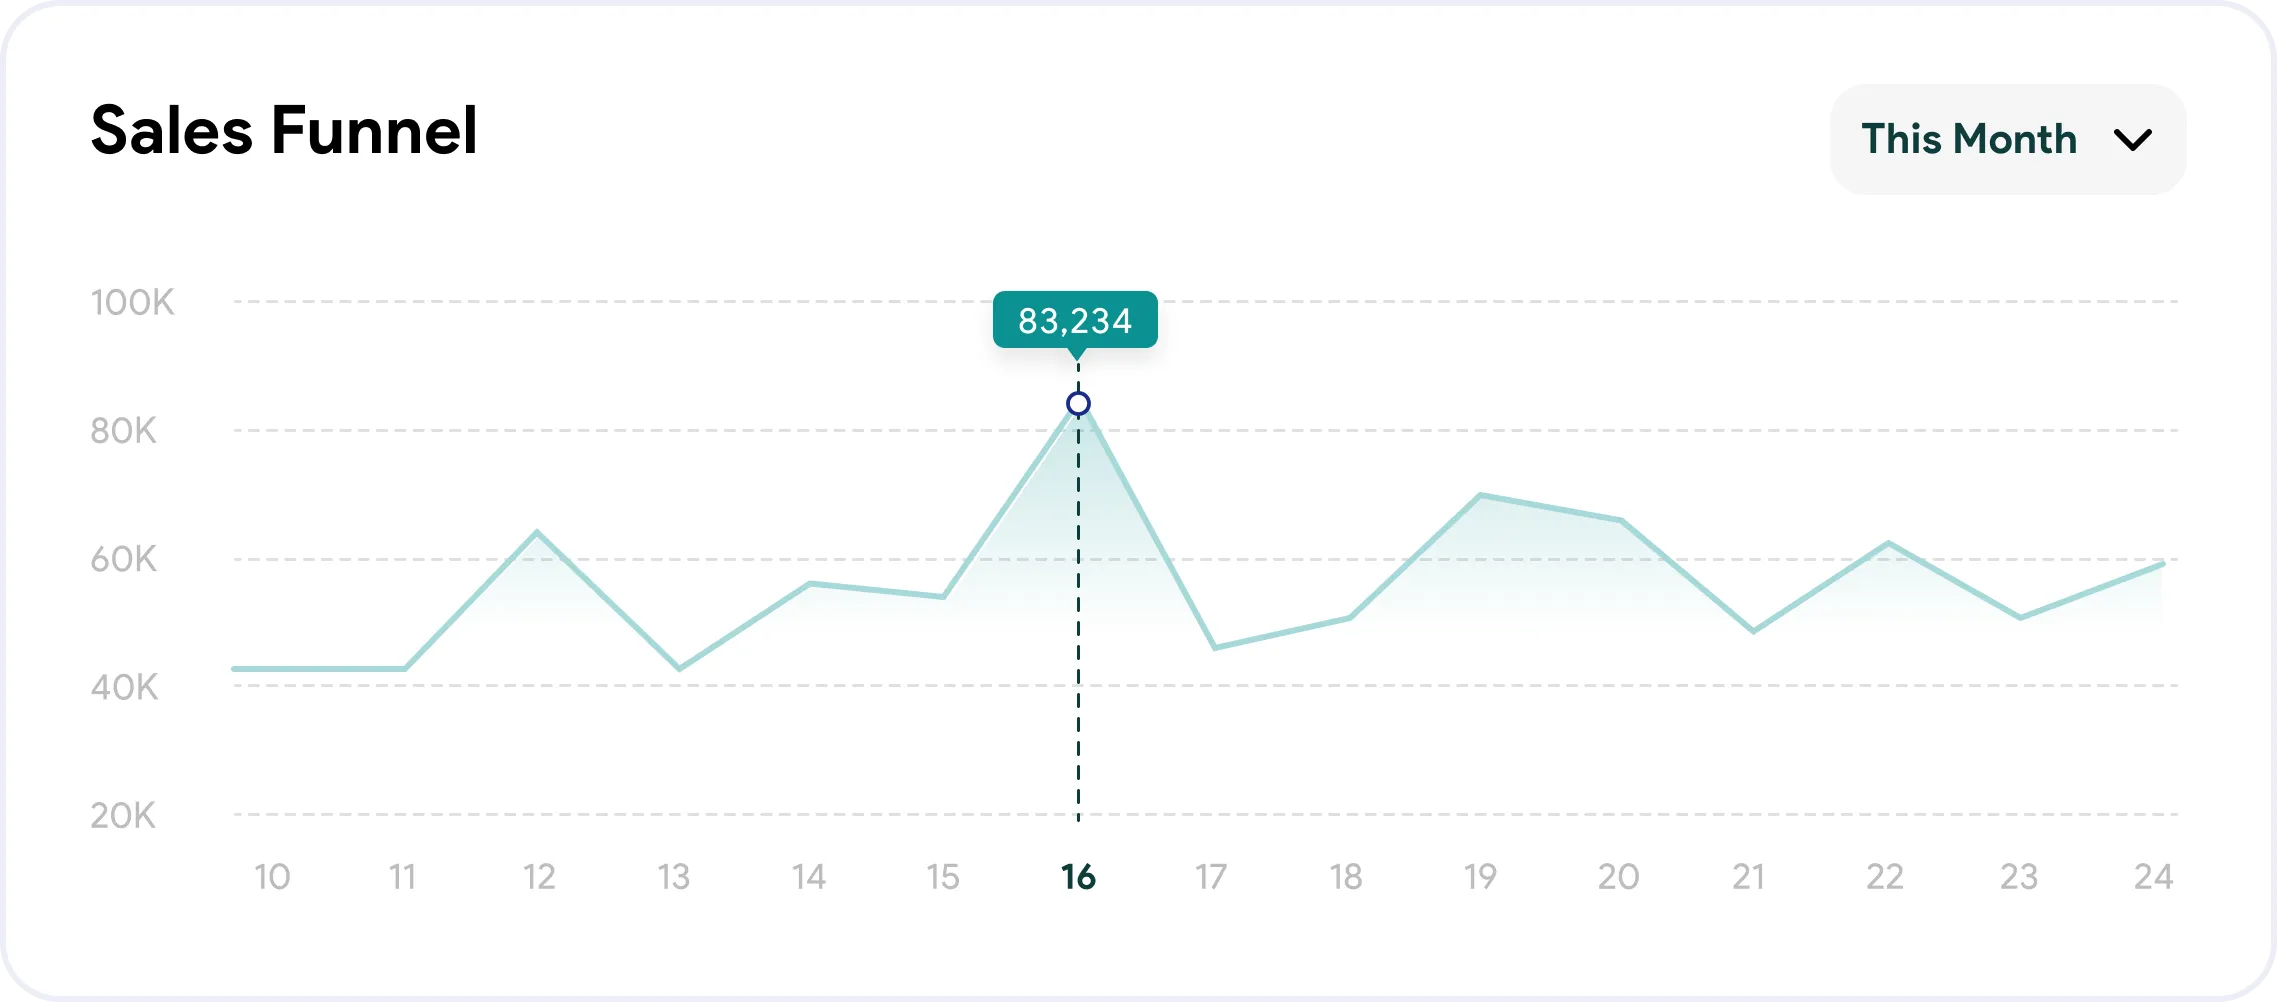
Data Visualization Tools
Communicating insights effectively is crucial, and DataNova provides over 25 customizable visualization templates, including:
- Bar charts, pie charts, and line graphs for trend analysis.
- Heat maps and scatter plots for pattern recognition.
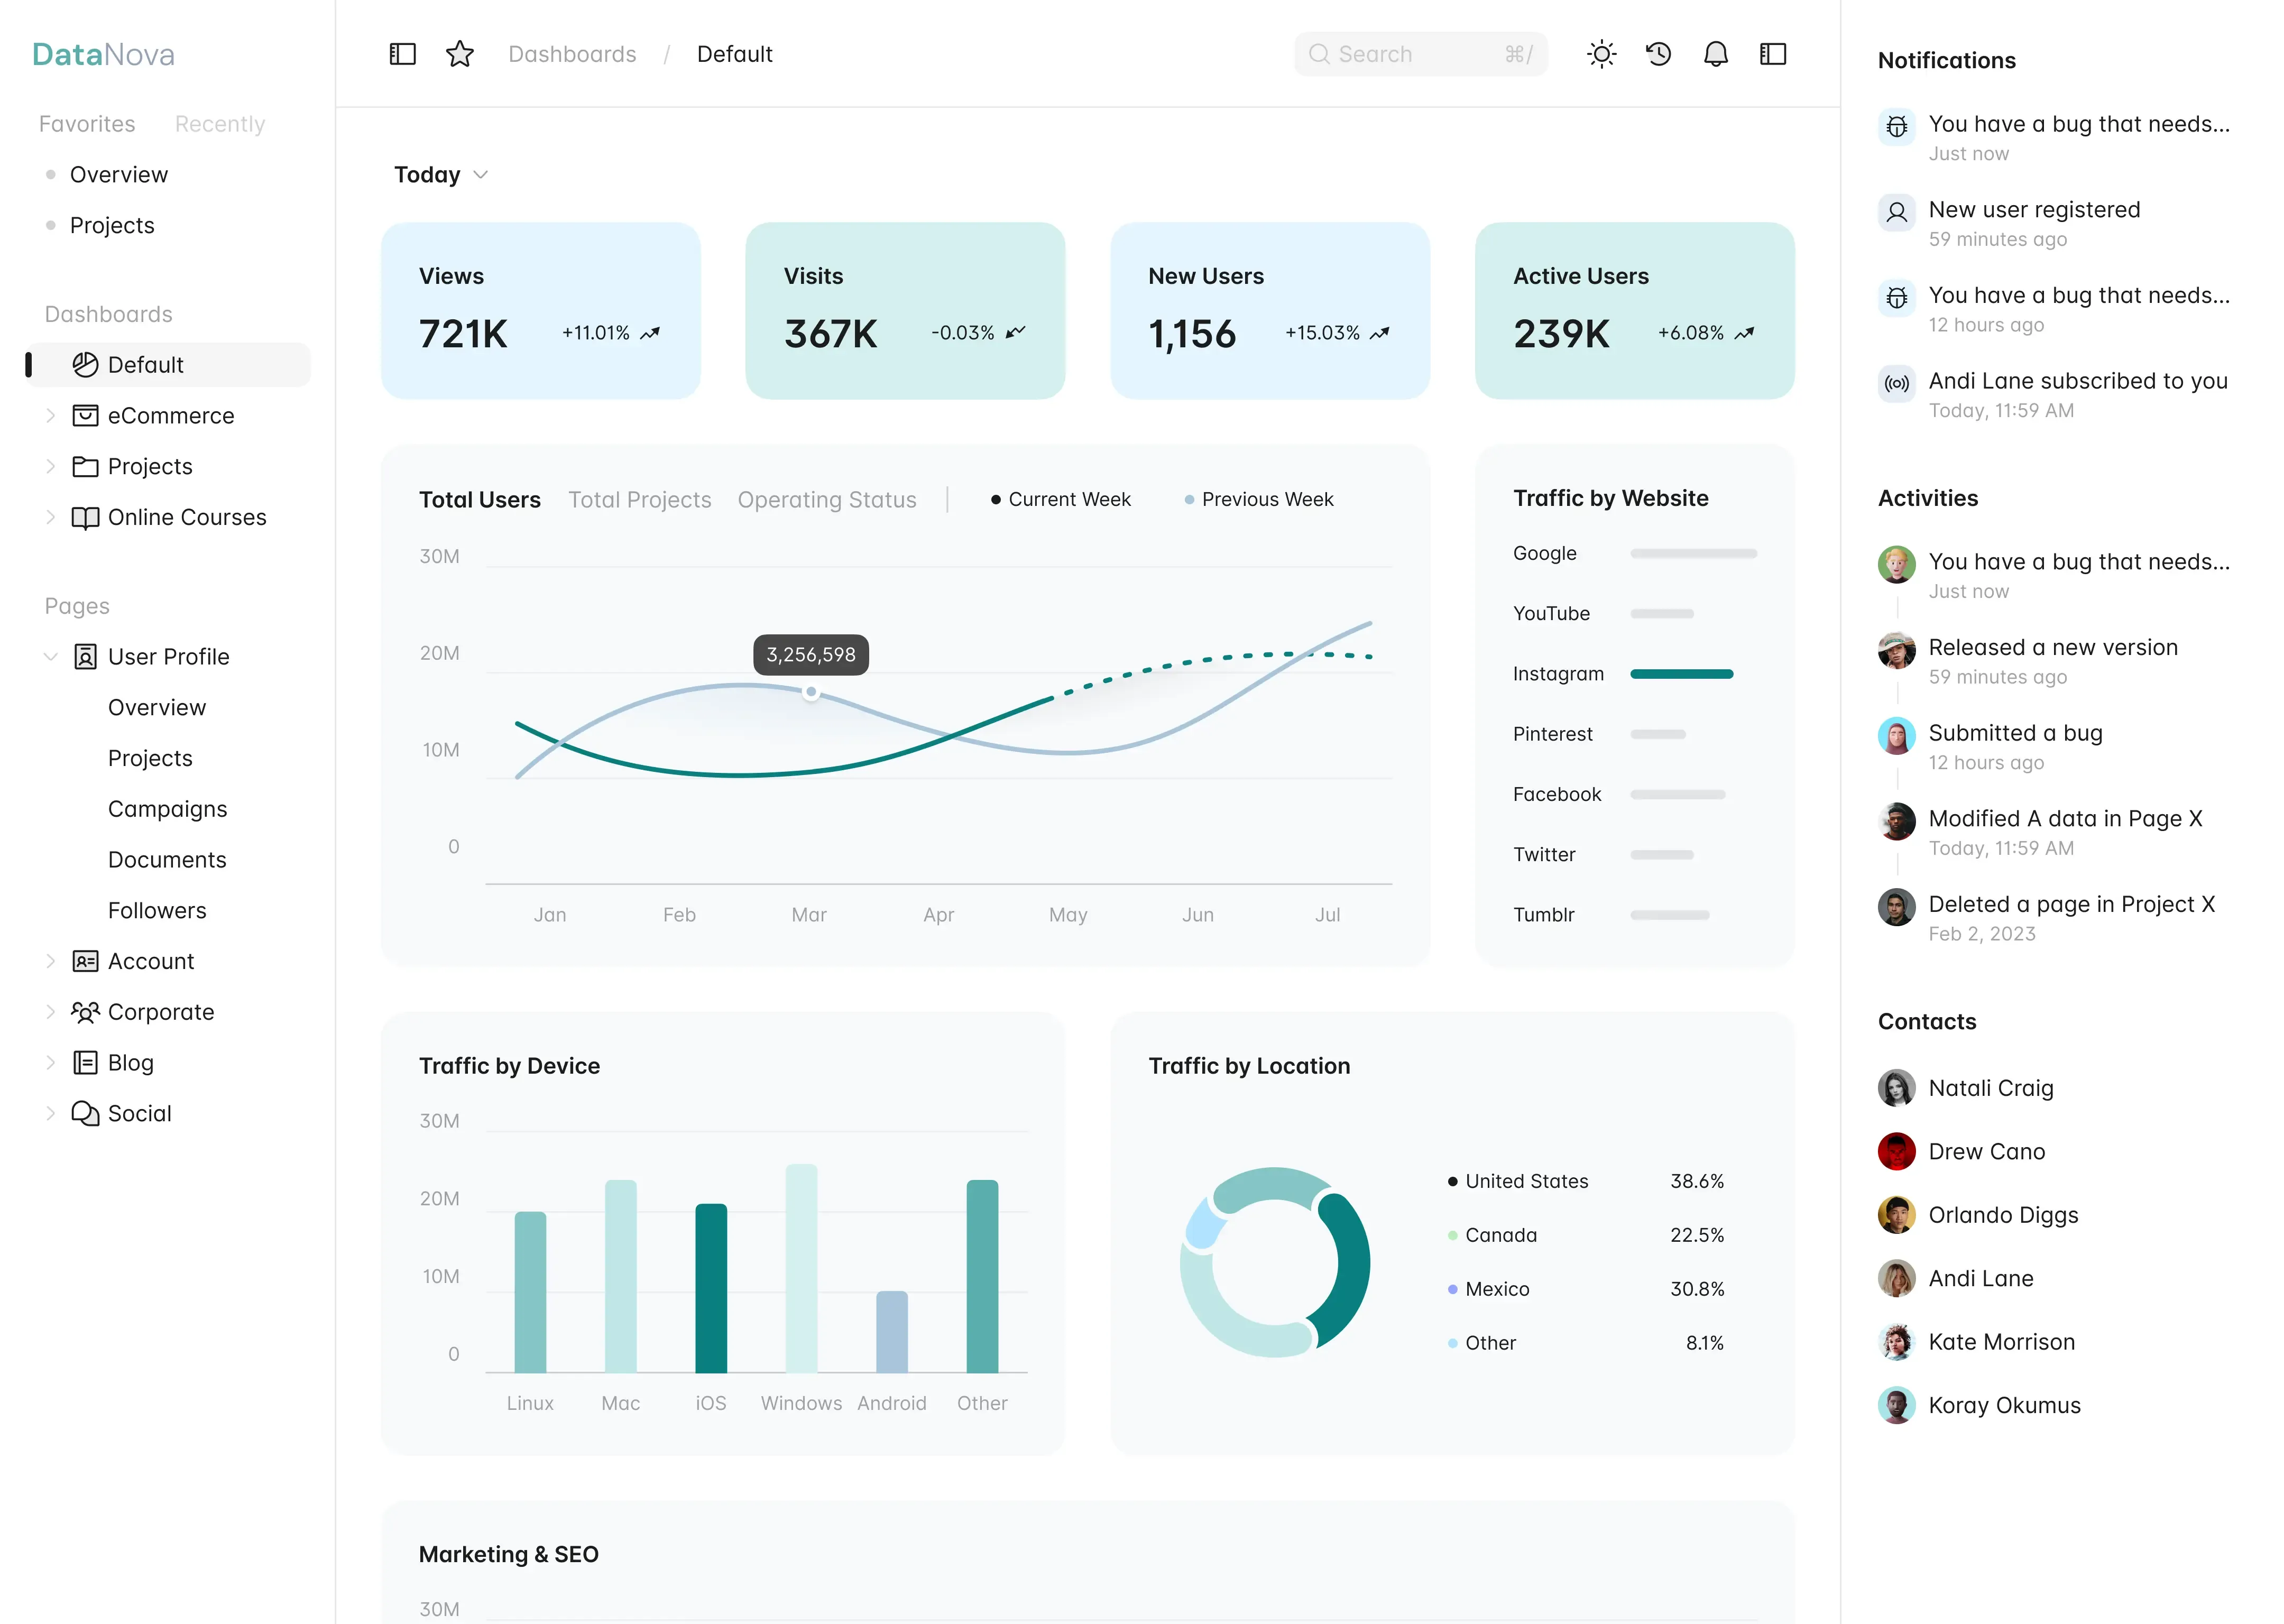
- Interactive dashboards that update in real time.
Step-by-Step Guide
1. Setting Up Your Workspace
- Launch Excel and navigate to the DataNova tab.
- Click “New Project” to initiate your analysis.
2. Importing & Preparing Data
- Select “Import” from the toolbar and choose your dataset.
- Use DataNova’s cleaning tools to handle missing values, normalize data, and apply transformations.
3. Running Analytics
- Navigate to the “Models” menu and select the desired statistical or machine learning model.
- Click “Apply” to execute the model and review results in the form of tables, charts, or detailed reports.
4. Interpreting & Sharing Results
- Customize your visualizations to highlight key insights.
- Export reports as PDFs, Excel files, or shareable dashboards.
Advanced Features
Predictive Analytics
Leverage DataNova’s AI-driven predictive engine to analyze thousands of data points and generate highly accurate forecasts. Ideal for market trends, demand planning, and risk assessment.
Real-Time Dashboards
Build dynamic dashboards that automatically update as new data is added, allowing you to monitor real-time changes in key performance indicators.
Automated Reports & Alerts
Set up scheduled reports and real-time alerts to receive notifications when significant changes occur in your data, ensuring you stay informed.
Conclusion
DataNova is designed to simplify complex analytics, making data-driven decision-making accessible to everyone. By following this manual, you can efficiently import, analyze, and visualize your data with confidence. Explore the full capabilities of DataNova and unlock the potential of your data today!